Precinct design for us is about creating great places. Places that are social, feel good, and that become part of the everyday life of a community. Design plays a vital role in creating great places, but to be successful, it needs to enhance local economies and ensure the public realm is active on day one, as well as sustainable in the long term.
In a world where the quality of a development is measured by that of its amenities, the success and resilience of a town centre, a mixed-use precinct or a new community depend on finding the right mix in the early stages of the design process.
Precinct design and masterplanning rely on expertise built over years of study and practice. That expertise can now be supported by technology, providing the ability to test assumptions and solutions before a place is built and understand what a design decision means for footfall, commercial performance and the long-term viability of a place well before any concrete is poured.
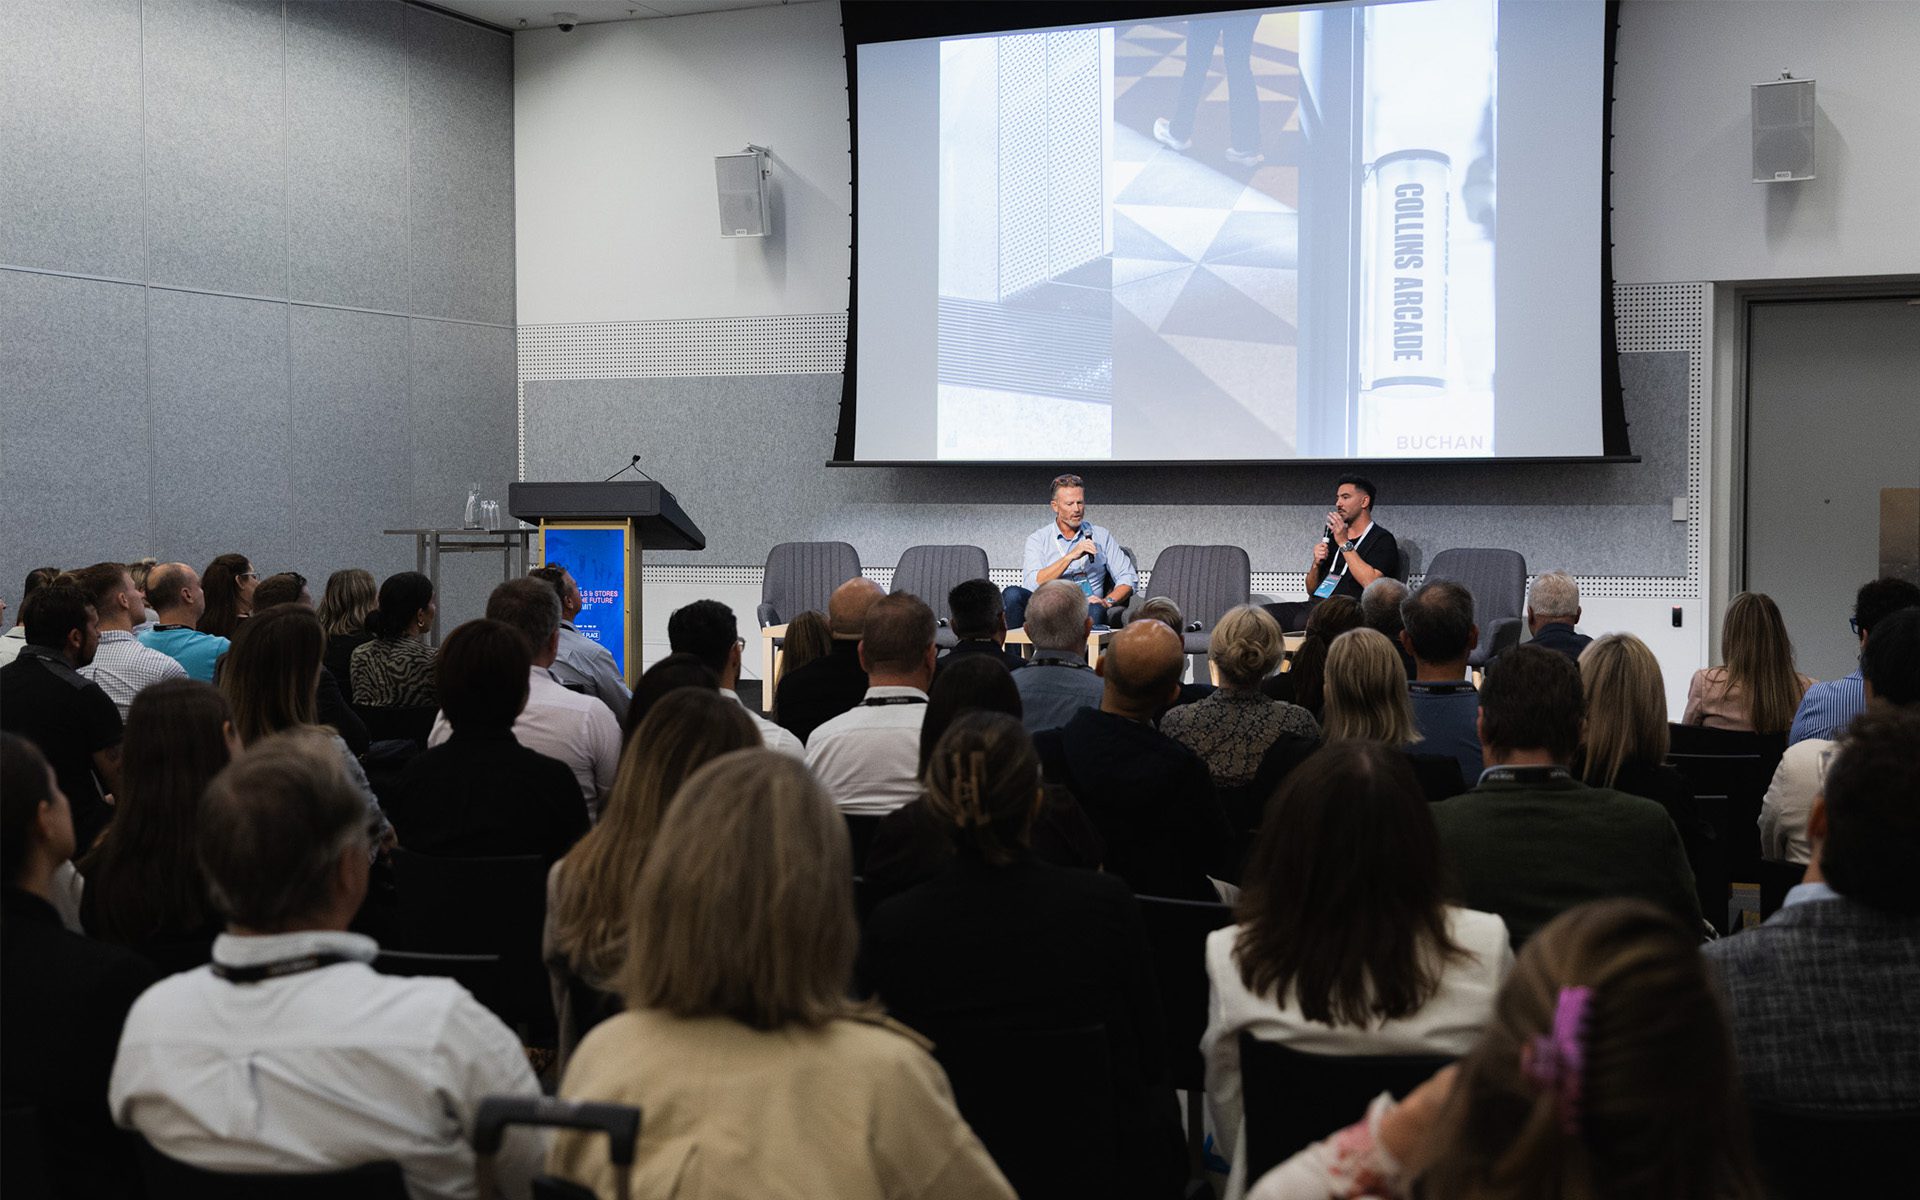
Buchan’s Alessandro Paladin and Hansen Tang explore.
What simulation makes possible
Simulation modelling introduces an objective measure into a process that has historically relied on expert judgement and intuition. By mapping pedestrian movement and measuring key spatial performance indicators across a scheme, designers can begin to answer questions that would otherwise remain unanswered until a place is occupied.
Many simulation tools are grounded in strong academic research yet struggle to connect with the commercial realities of how places are designed, funded and built. They generate outputs that satisfy a process but struggle to meaningfully inform decisions.
Buchan has developed a proprietary data-informed design workflow that combines spatial analysis, movement simulation and precinct design expertise to support evidence-based design decisions. The value of these tools is in how they are applied: defining the questions that matter commercially, setting up movement assumptions based on local context, seamlessly embedding the simulation in the iterative design process, and translating outputs into clear parameters that can inform decisions.
A data-informed design workflow
Good masterplanning, amongst other things, is based on good connectivity – how people move through a place; legibility – what they can see from where they are; and economic sustainability – whether the mix of uses and tenants support one another to create a whole that is more than the sum of its parts.
These aspects are interrelated but often difficult to judge holistically. A layout that maximises lettable area may compromise the movement conditions that make those tenancies viable. A configuration that prioritises visibility may create circulation patterns that work against footfall distribution.
Our workflow is based on the introduction of virtual users (‘agents’) that enter the simulation environment and proceed to their intended destinations. As their movement is tracked, it generates insights on how spaces are likely to be used.
Model results are aggregated into three key performance measures and tracked across every design iteration for comparison.
The key performance measures are:
Footfall distribution
This records the number of virtual users traversing each circulation route. As footfall is directly correlated with sales, the distribution can highlight high value areas of a masterplan. For direct comparison, the median footfall is extracted from each design iteration. A high median footfall corresponds to a highly productive configuration, one that minimises the number of routes with little foot traffic, ensuring the productivity of the investment on circulation spaces.
Tenancy exposure
This represents the number of times a shopfront enters a virtual user’s cone of vision as they travel through a space. A prominent shopfront along a highly trafficked route will measure a high score, while a less prominent shopfront on a poorly frequented route will measure a low score. As visibility is also correlated with sales, this measure can help to identify high value tenancies and inform leasing strategies. For direct comparison, the median exposure is extracted from each design iteration to identify the scheme with the desired number of high value tenancies.
Lettable area
Aside from the traditional impact this has on projected income, cost and feasibility, this parameter is also used to inform the number of virtual users that enter the simulation, on the basis that a larger and more diverse offer attracts a larger catchment. This ensures the accuracy of the simulation and ultimately that the three performance parameters are considered holistically.
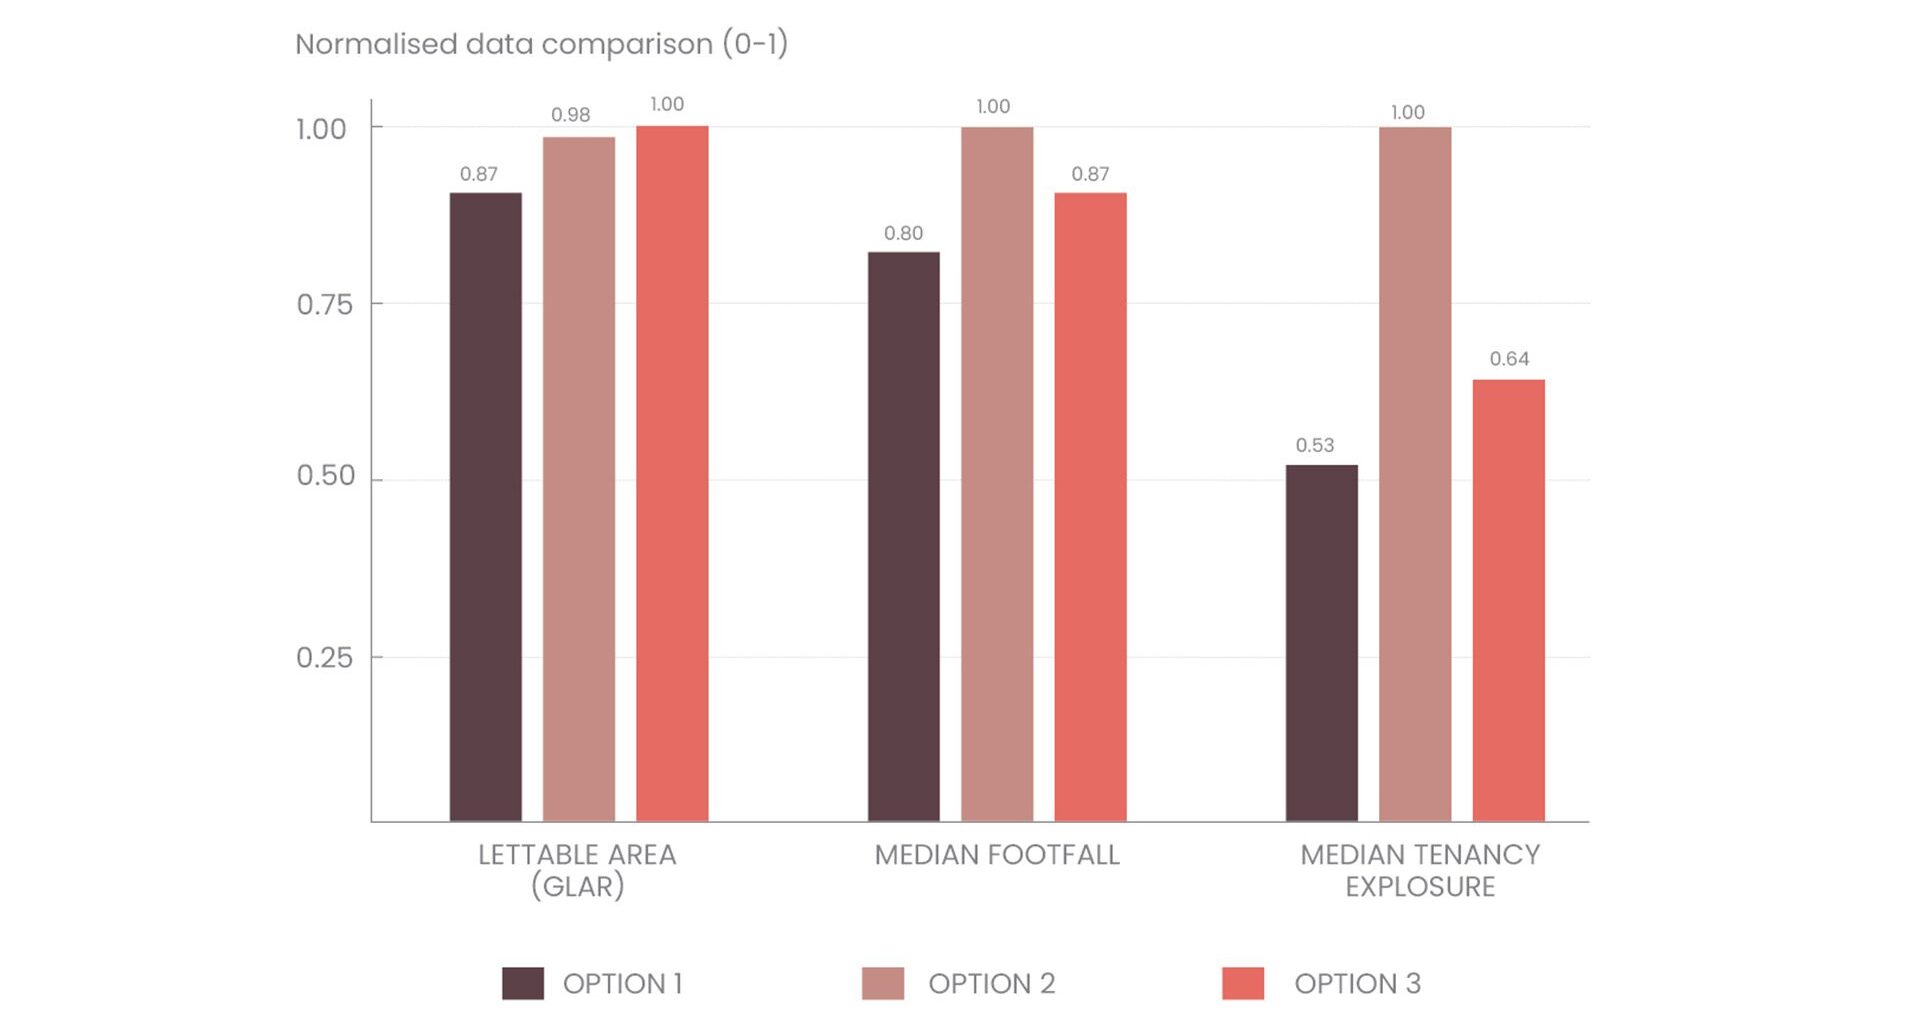
Dashboard showing key criteria – footfall distribution, tenancy exposure and lettable area (GLAR). Values normalised for comparison.
The workflow is embedded in the design team’s day-to-day tools, removing the need for time-consuming remodelling between iterations. Simulations are returned in minutes, not days – making it practical to test options from concept through to leasing response.
Data-informed design in practice
The workflow was applied to a newly masterplanned 12-hectare Town Centre situated in South East Queensland, comprising a retail, dining and entertainment precinct. As a destination centre, the development was required to balance spatial and commercial performance with the capacity to meet the needs of a growing community.
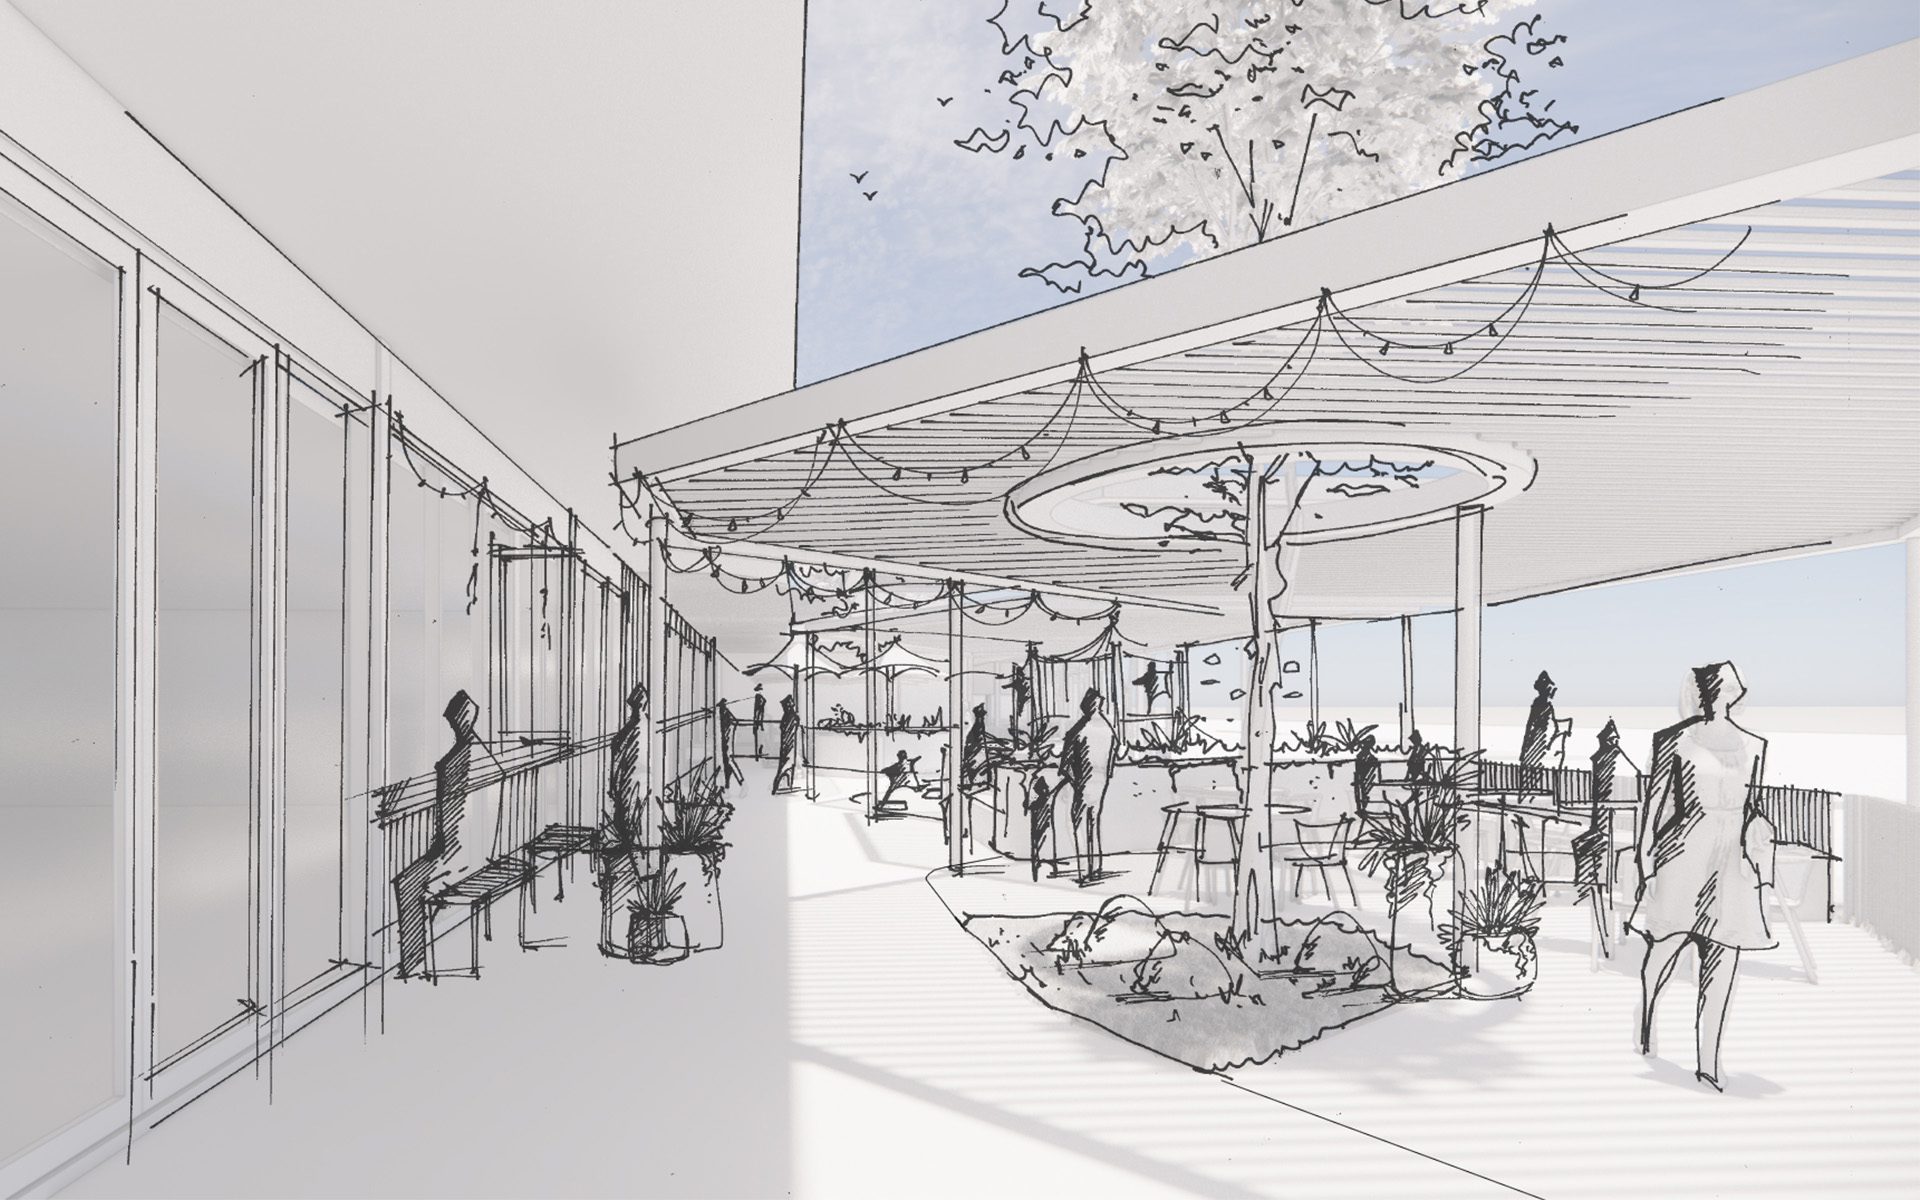
Across multiple design scenarios, from early multi-level options centred on a department store or supermarket anchor, through to a series of single-level iterations refined against leasing input, movement and visibility modelling allowed the team to identify which configurations were working and, critically, why others weren’t. Iterations that registered poor spatial performance could be explained with evidence.
Where spatial performance was being traded against yield, the model quantified that trade-off, providing an objective basis for staging decisions and longer-term investment confidence. The adopted design, and the refinements made to it in response to leasing input, was the result of that process.
The process
The workflow begins with the design itself. Spatial elements – built form, active frontages, entries and movement paths – are mapped directly from the working design (i).
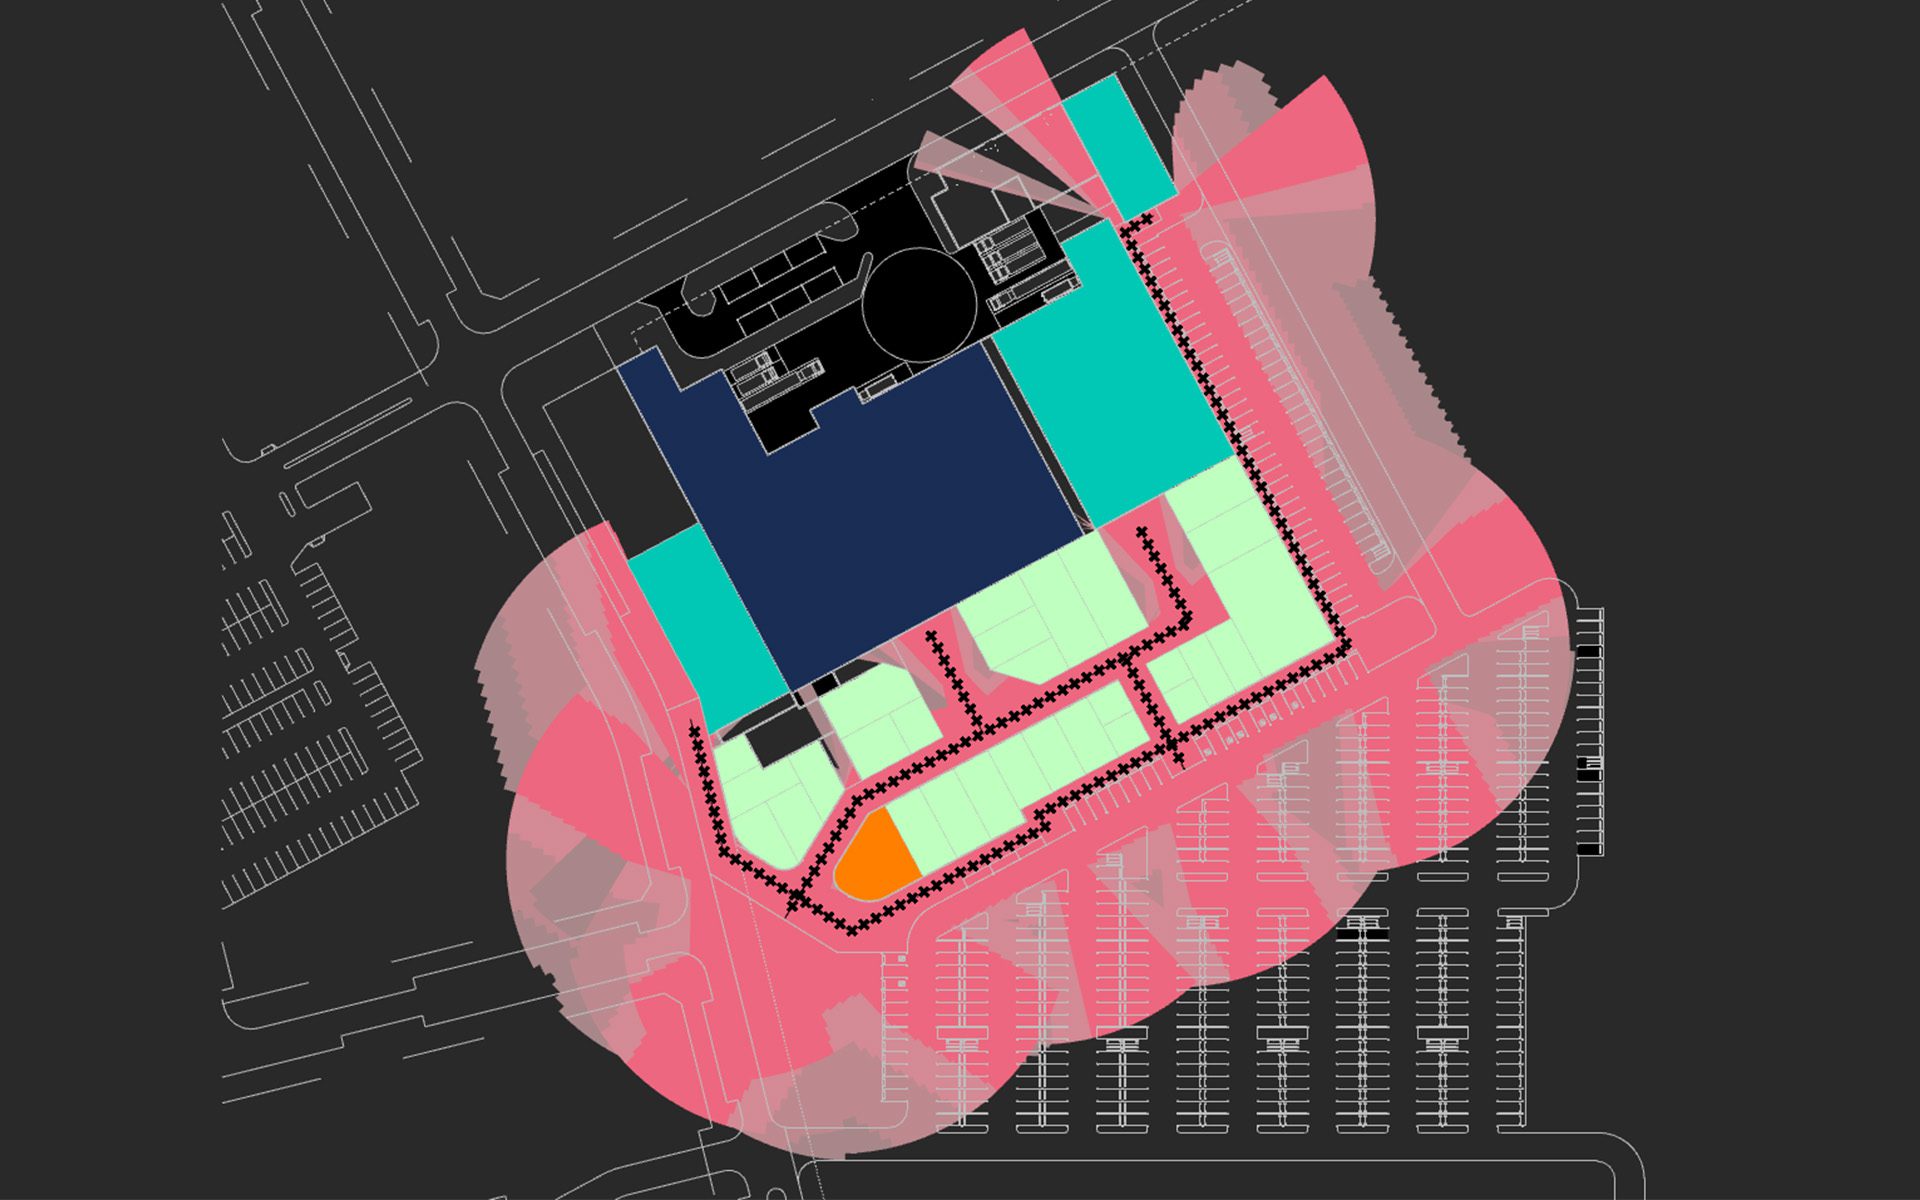
i. Spatial mapping with footfall checkpoints and visibility radii overlay.
From that foundation, movement assumptions are set based on clearly defined ‘personas’ aligned, where available, with user community and catchment data. These site-specific inputs define how far people will travel, which destinations will draw them, how each entry point connects to the wider network (ii). These parameters are not technical defaults; they are design judgements, informed by commercial expertise and an understanding of how people use places. It is the quality of those questions, as much as the simulation itself, that determines whether the outputs are useful.
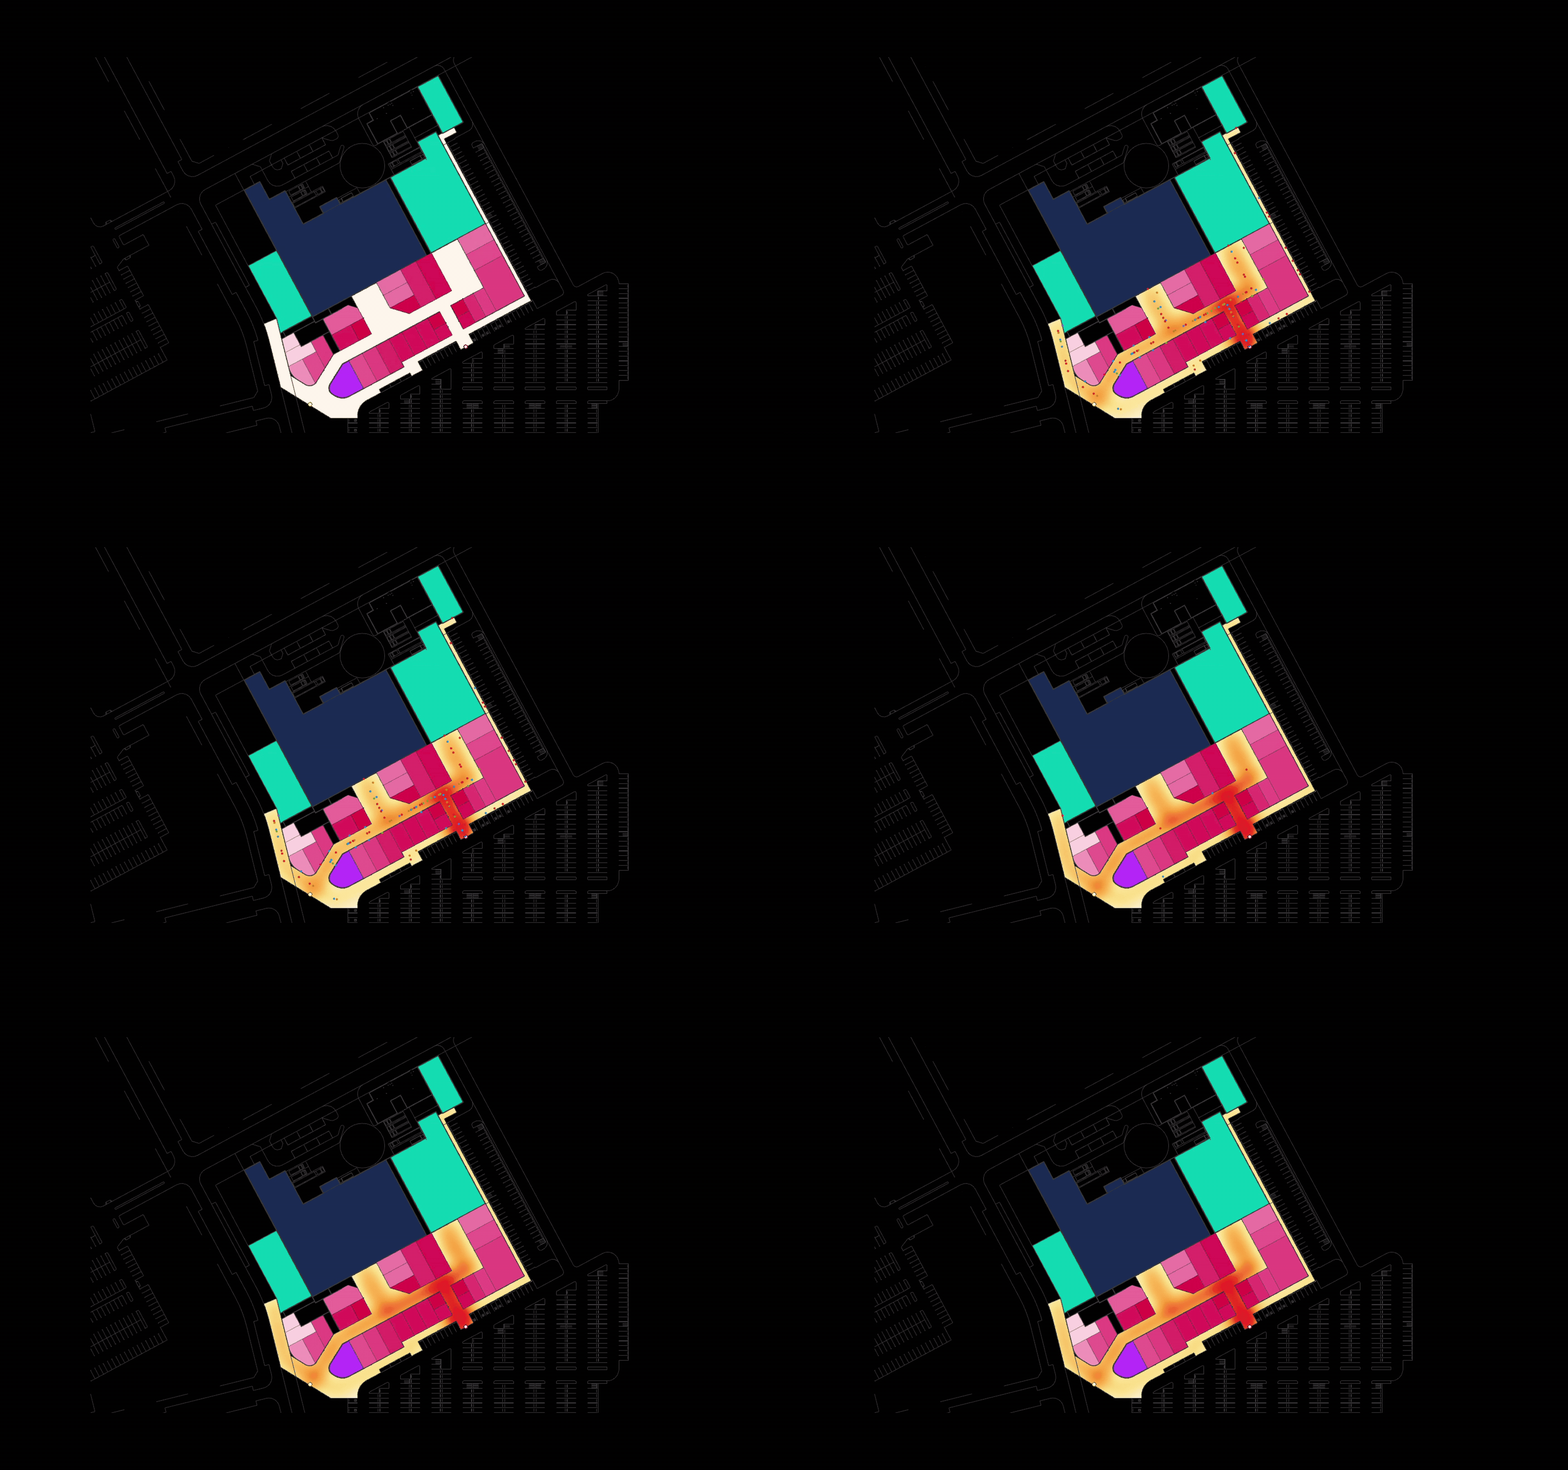
ii. Movement generators and path logic
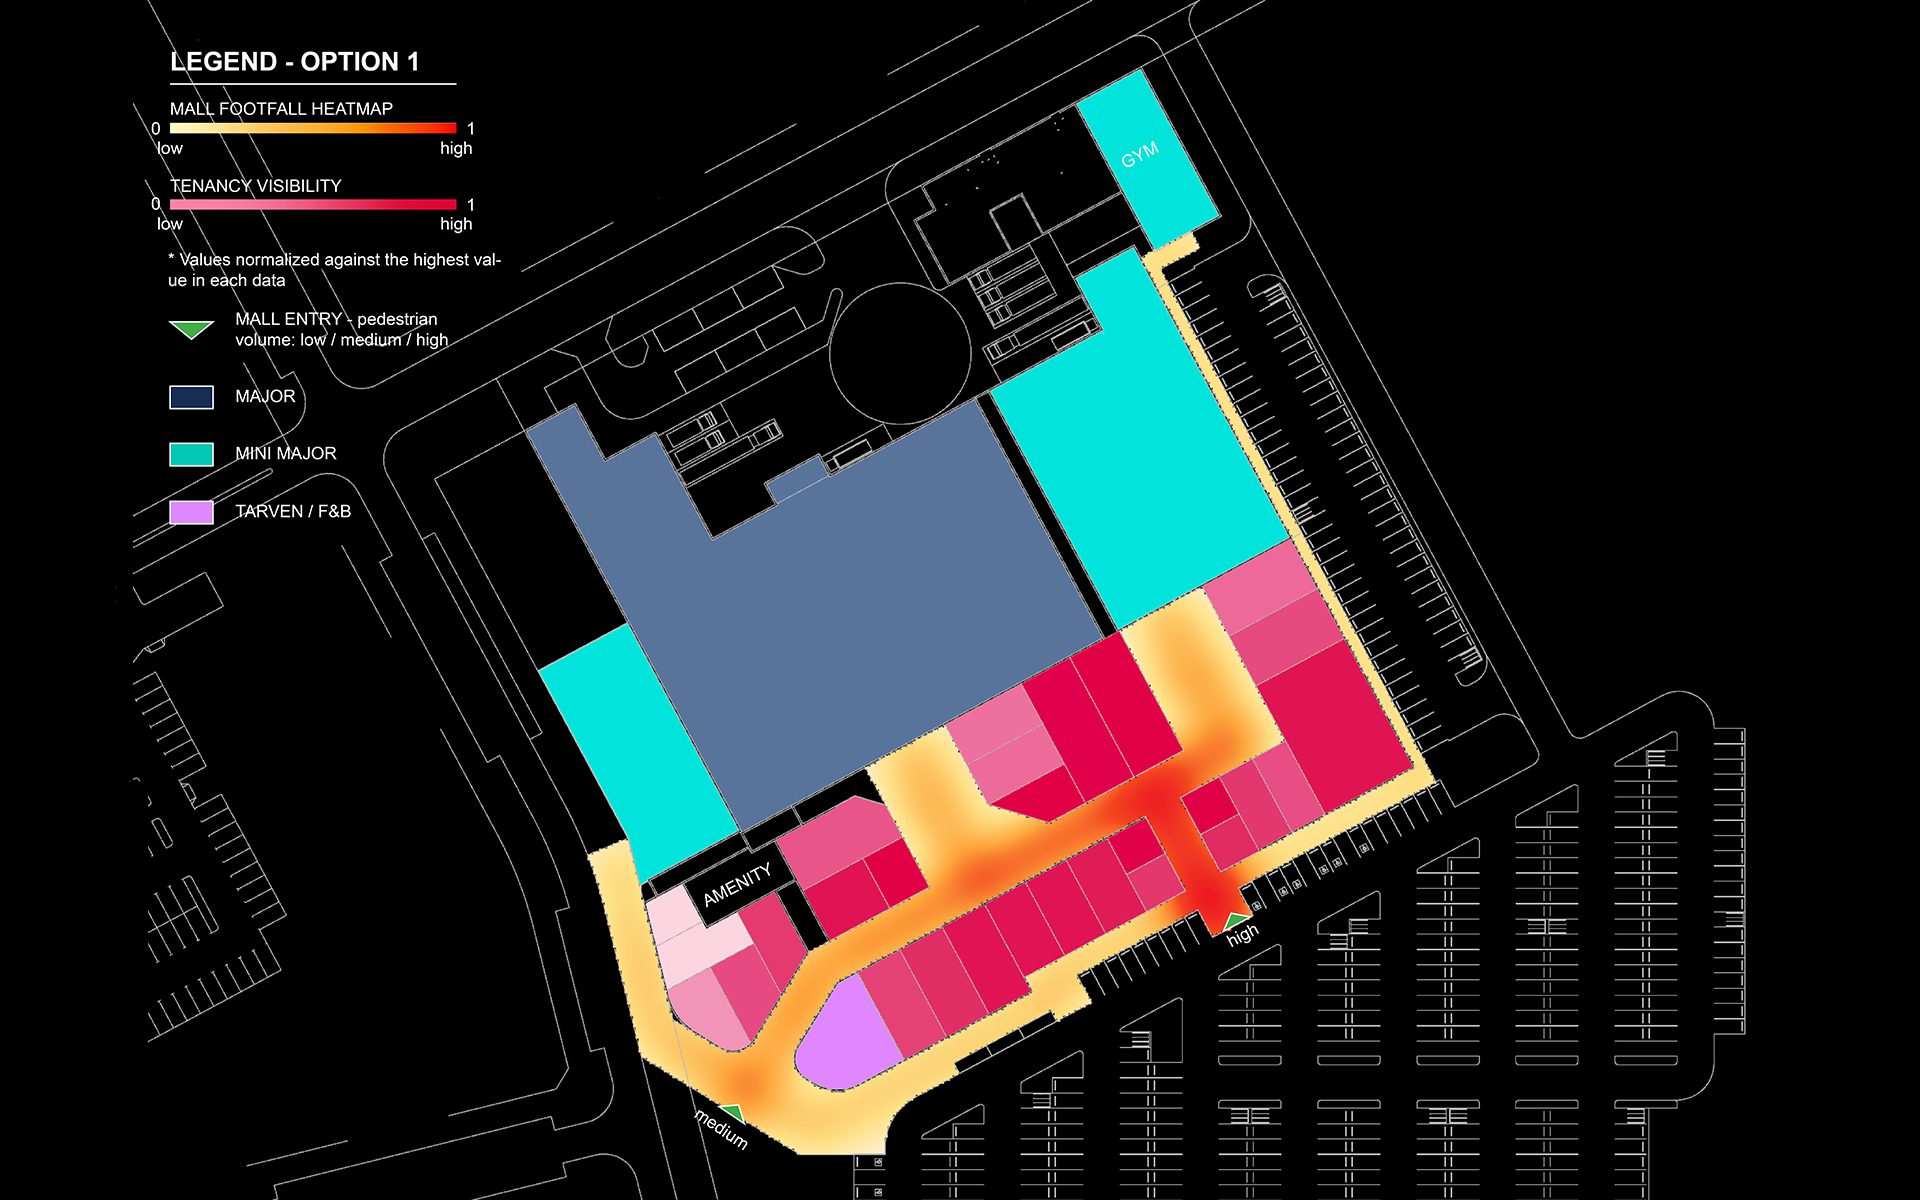
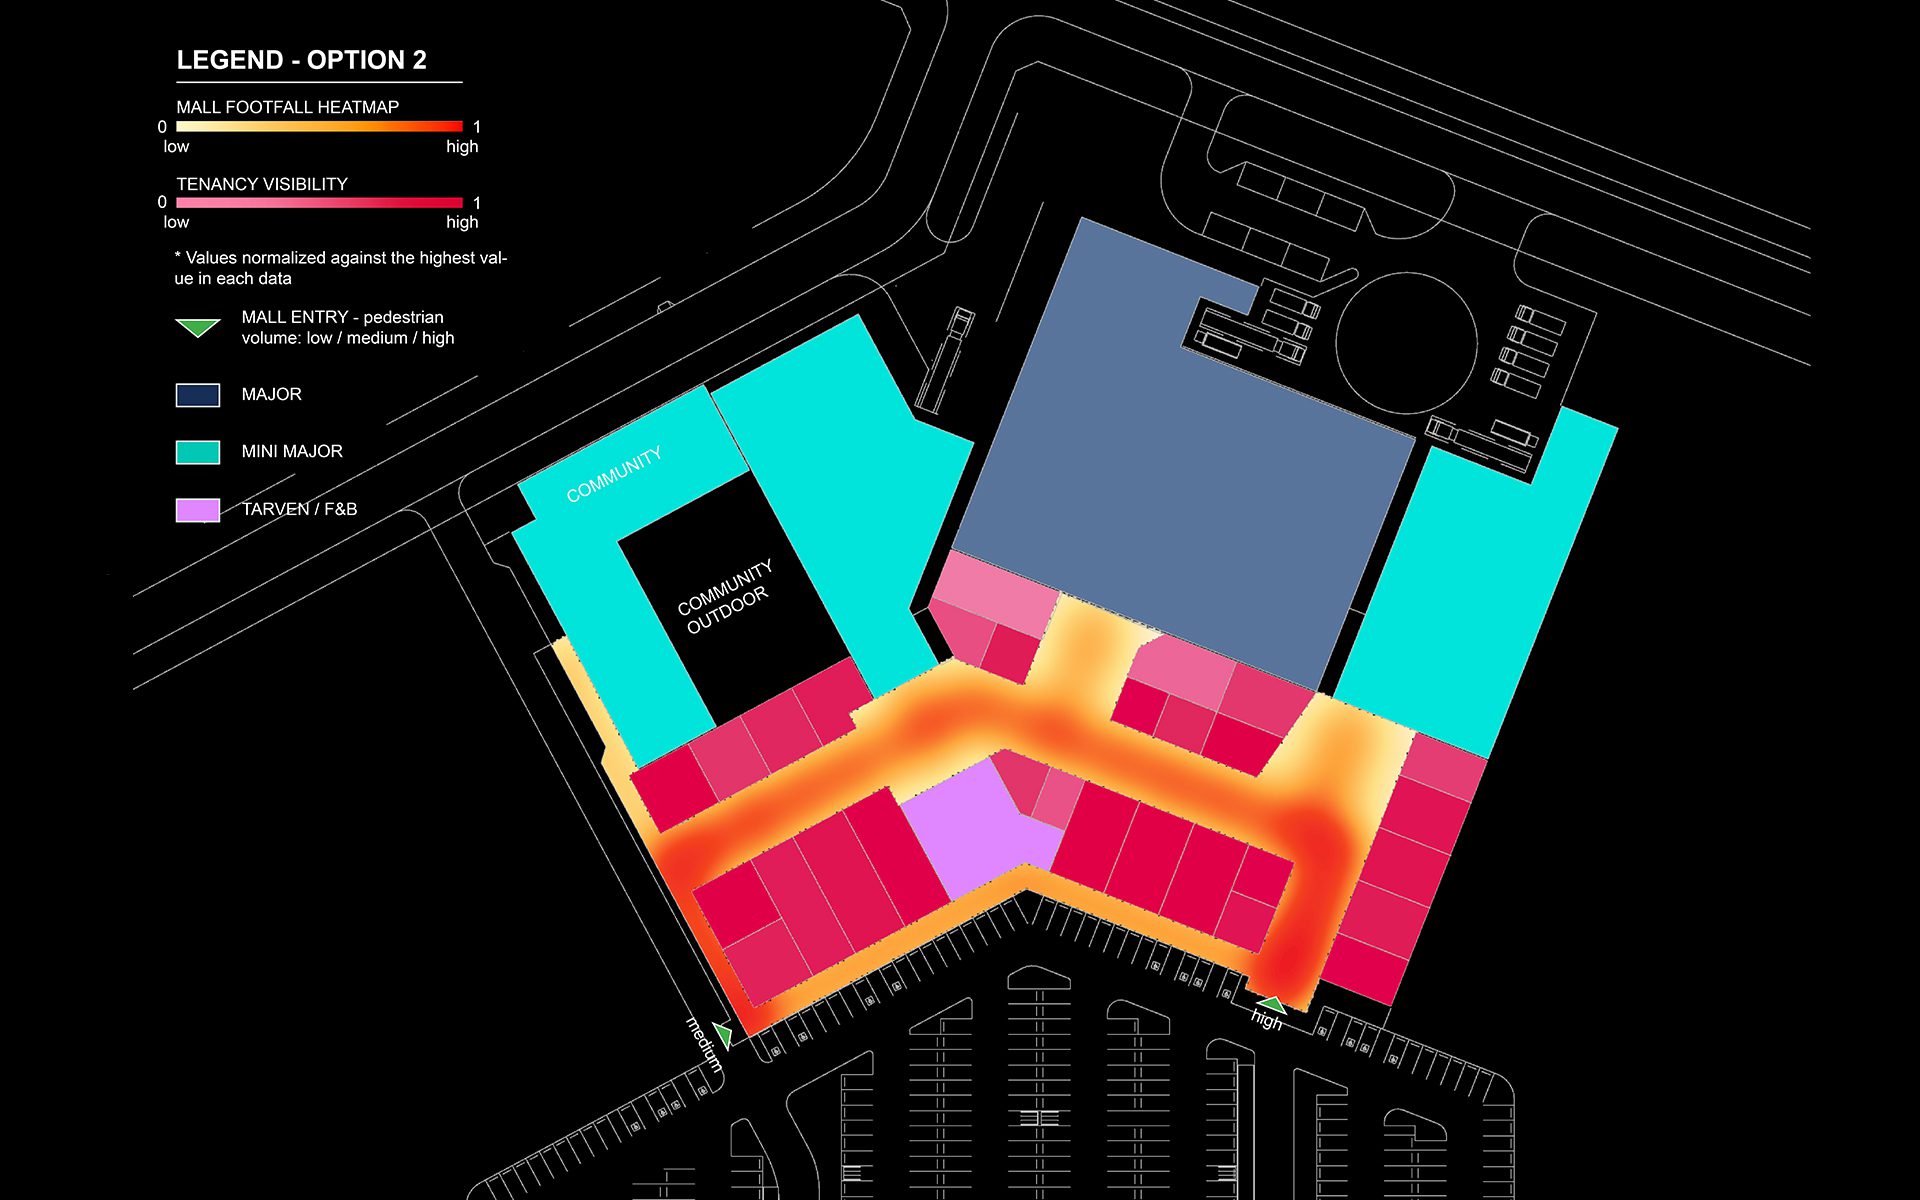
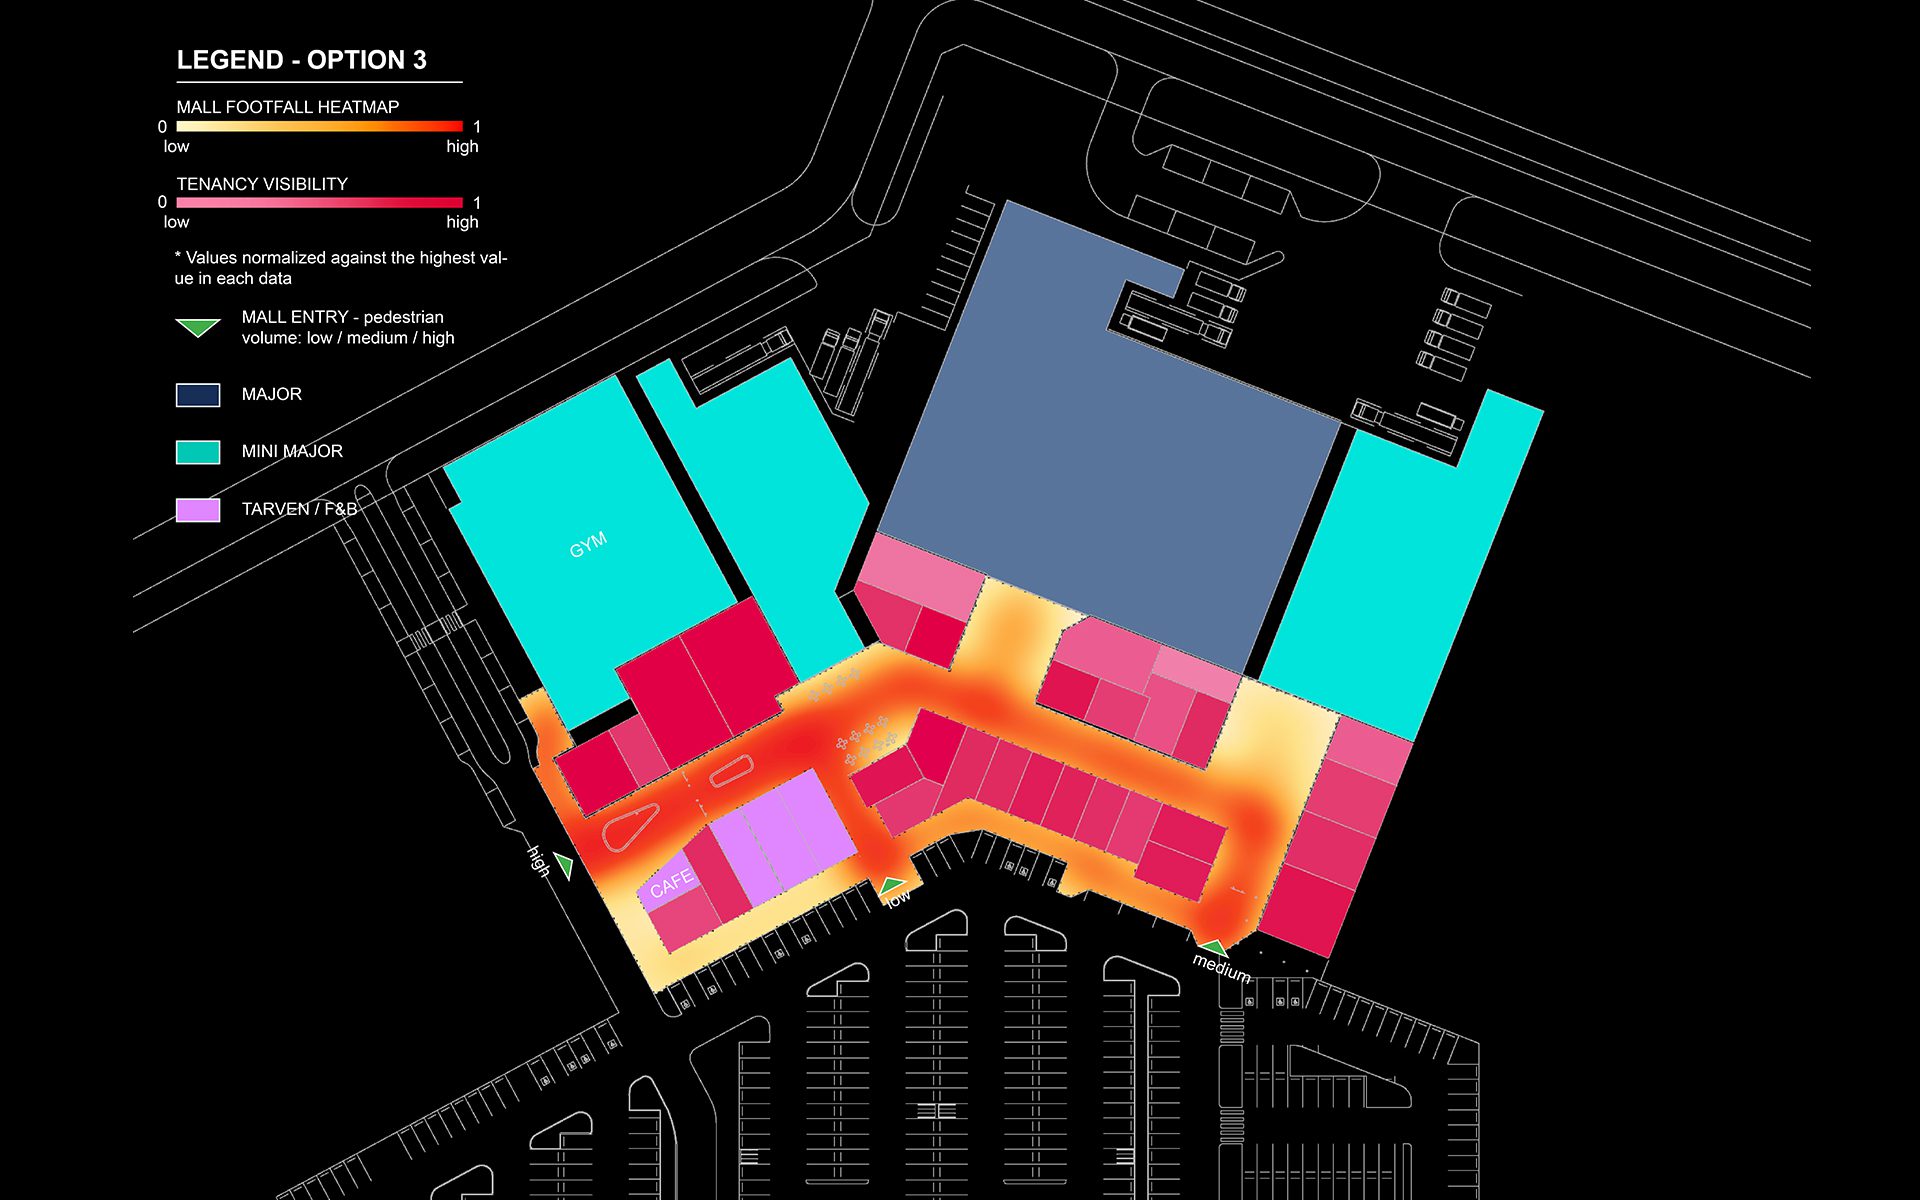
The simulation generates two outputs against which design scenarios can be assessed and compared: a movement heatmap recording pedestrian intensity across circulation routes, and a visibility map measuring the exposure of key frontages from arrival points and key circulation routes throughout the scheme (iii). As the design evolves, the model evolves with it – scenarios are tested, reviewed and refined as part of the same iterative process that produces the design rather than as a separate analytical exercise.
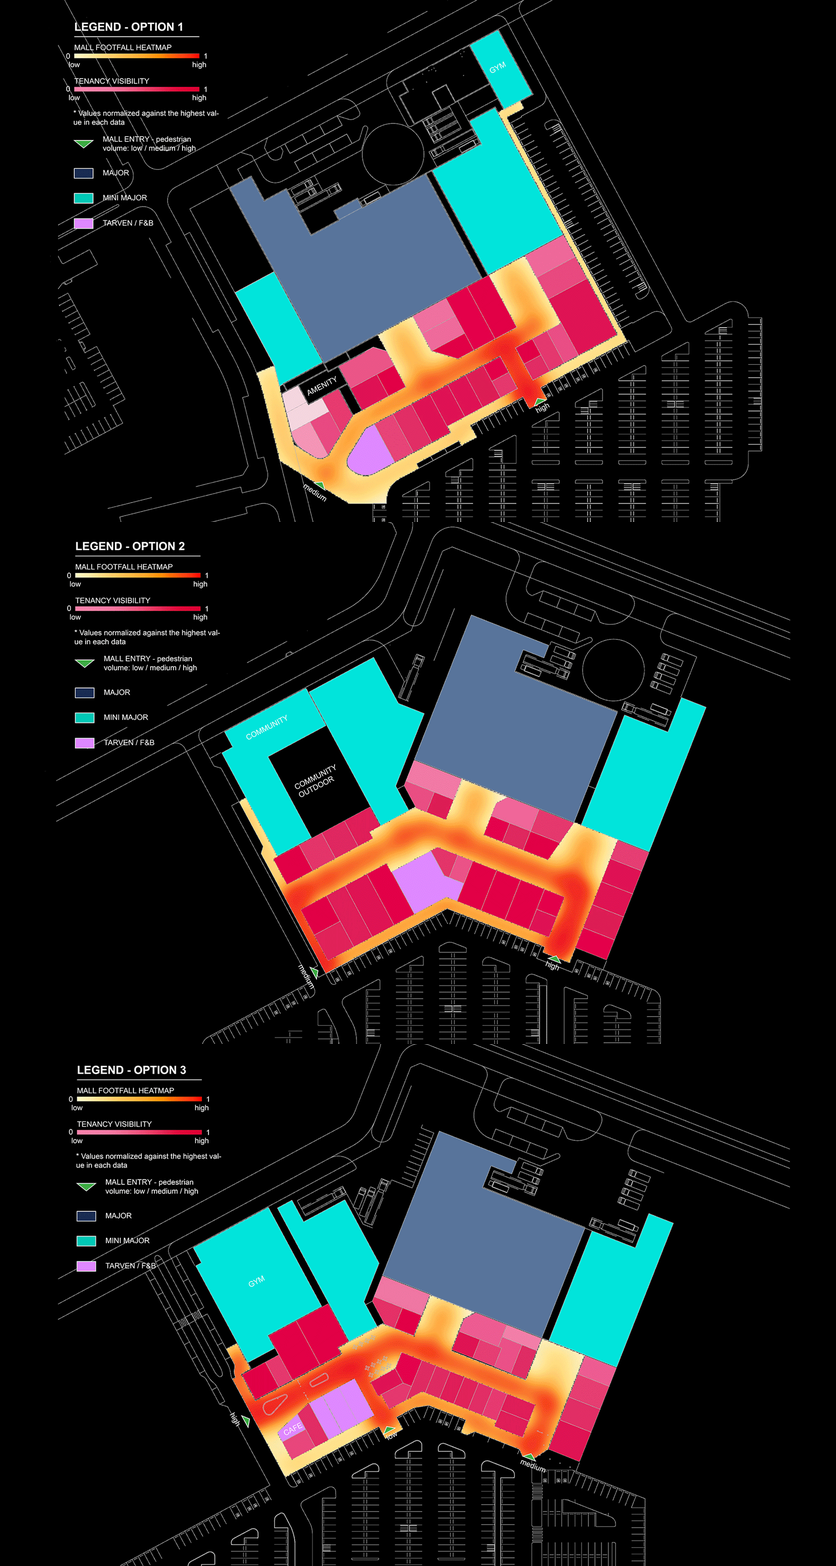
iii. Movement and visibility heatmaps
Key performance indicators are extracted into a comparative dashboard, making it straightforward to assess options side by side and communicate the reasoning behind a preferred direction to developers, leasing teams and consenting authorities.
Simulation in service of design decisions
As simulation becomes standard practice across masterplanning and urban design, the differentiator is no longer access to the technology. It is knowing what to ask of it. Outputs are only as useful as the questions that generate them, and those questions require commercial intelligence, spatial expertise and design judgement that no tool can substitute. For developers and consenting authorities, the value is in the verification of design directions that are grounded in spatial and commercial evidence. The simulation doesn’t replace design judgement. It strengthens it with objective evidence. The tools don’t make the decisions. They make better decisions possible.
About the authors
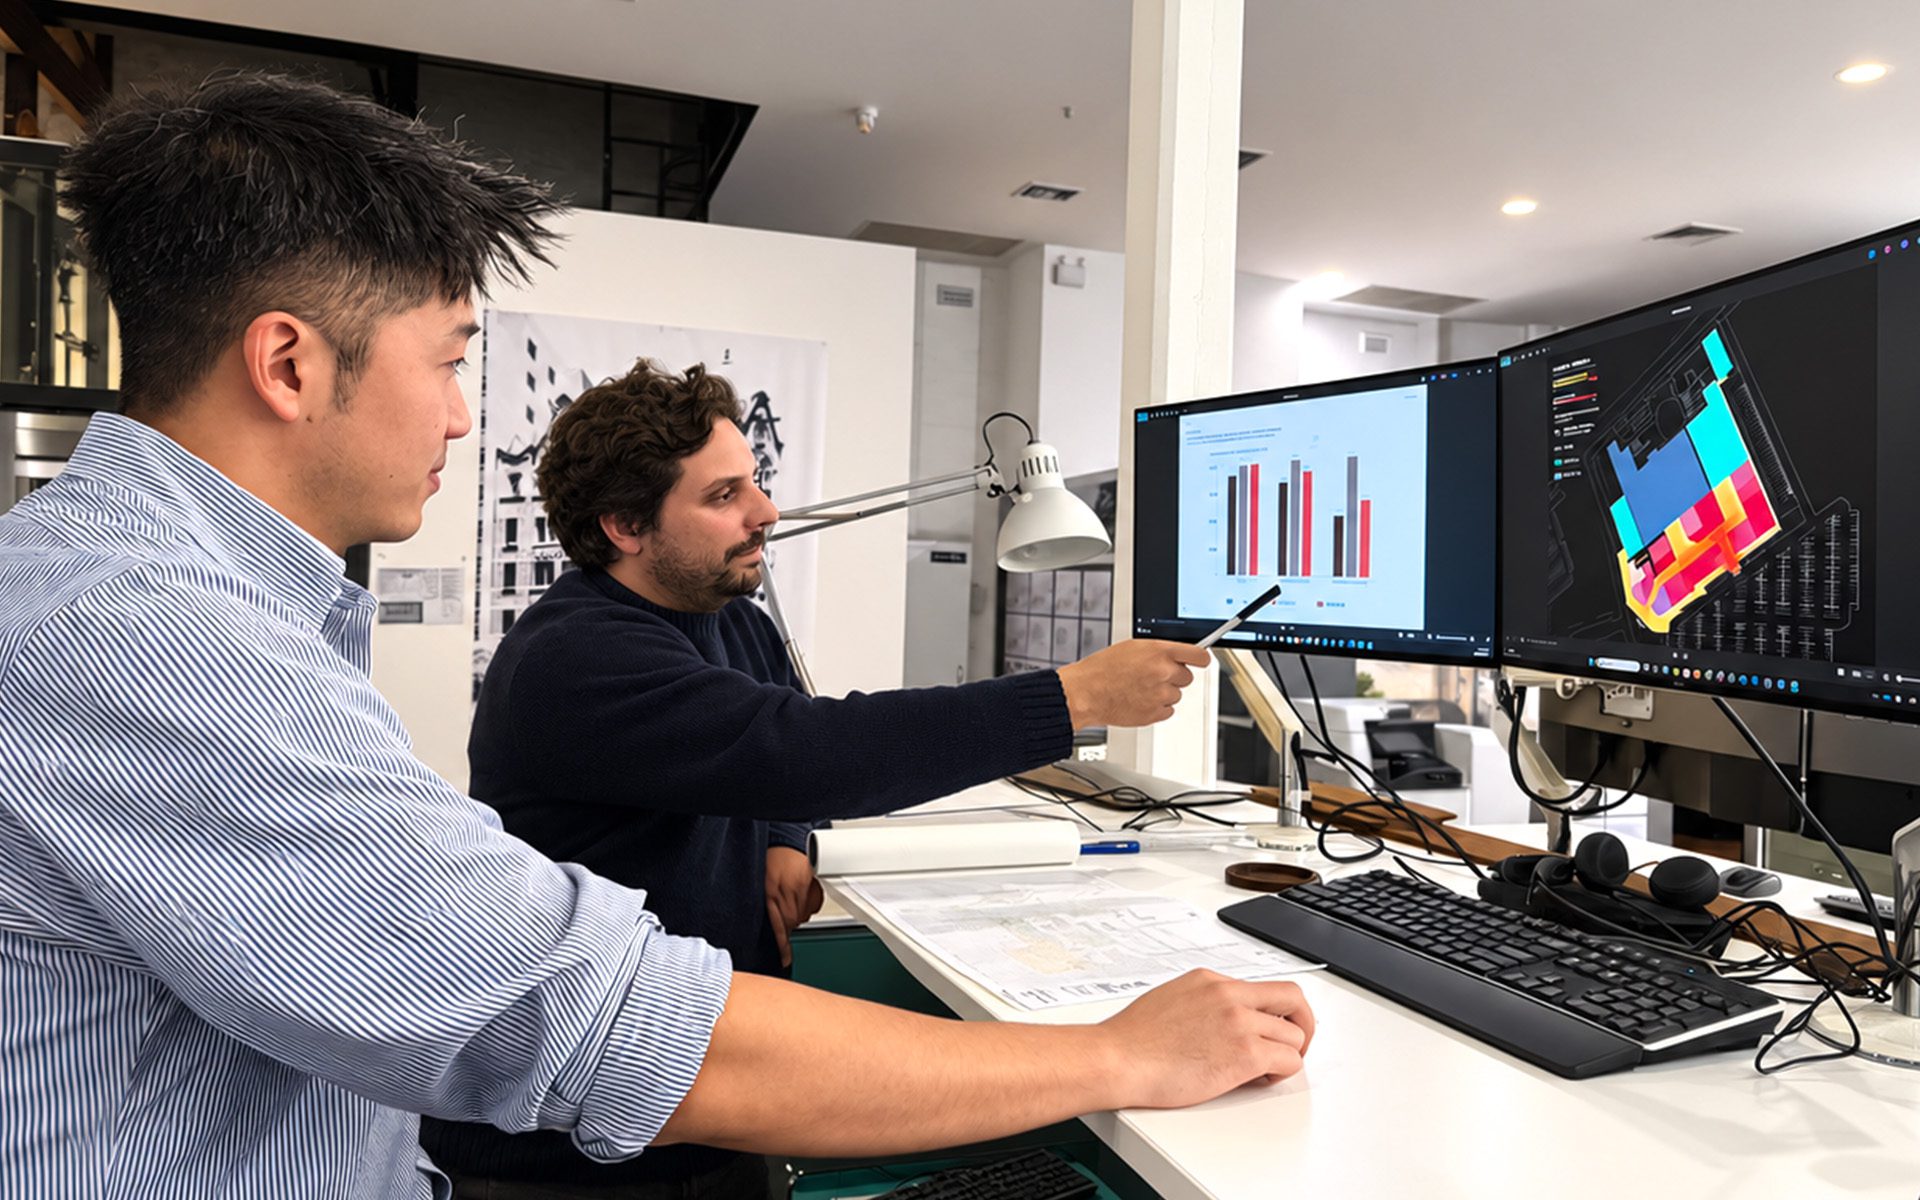
Alessandro Paladin and Hansen Tang (pictured left)
Alessandro Paladin
Alessandro Paladin is a Principal at Buchan with international experience spanning Australia, Asia and Europe. Working across retail, mixed-use, residential, cultural and civic projects, he advocates for data-informed design approaches that balance commercial, social and environmental outcomes, translating complex challenges into clear and effective design solutions.
Hansen Tang
Hansen Tang is a Designer at Buchan whose expertise spans architecture, computational design and software development. Combining a design background with technical fluency, he focuses on data-driven design processes, workflow optimisation and the application of digital tools to improve design outcomes across retail and mixed-use projects.